

Aerospace and defense company Raytheon (NYSE:RTX) reported Q2 CY2025 results beating Wall Street’s revenue expectations, with sales up 9% year on year to $21.58 billion. The company’s full-year revenue guidance of $85.13 billion at the midpoint came in 1% above analysts’ estimates. Its non-GAAP profit of $1.56 per share was 9.1% above analysts’ consensus estimates.
Is now the time to buy RTX? Find out by accessing our full research report, it’s free.
RTX (RTX) Q2 CY2025 Highlights:
- Revenue: $21.58 billion vs analyst estimates of $20.65 billion (9% year-on-year growth, 4.5% beat)
- Adjusted EPS: $1.56 vs analyst estimates of $1.43 (9.1% beat)
- Adjusted EBITDA: $3.34 billion vs analyst estimates of $3.25 billion (15.5% margin, 2.5% beat)
- The company lifted its revenue guidance for the full year to $85.13 billion at the midpoint from $83.5 billion, a 1.9% increase
- Management lowered its full-year Adjusted EPS guidance to $5.88 at the midpoint, a 3.3% decrease due to the company's "current assessment of the impact of tariffs"
- Operating Margin: 9.9%, up from 2.7% in the same quarter last year
- Free Cash Flow was -$72 million, down from $2.2 billion in the same quarter last year
- Organic Revenue rose 9% year on year, in line with the same quarter last year
- Market Capitalization: $202.5 billion
Company Overview
Originally focused on refrigeration technology, Raytheon (NSYE:RTX) provides a a variety of products and services to the aerospace and defense industries.
Revenue Growth
A company’s long-term sales performance can indicate its overall quality. Any business can experience short-term success, but top-performing ones enjoy sustained growth for years. Unfortunately, RTX’s 5.7% annualized revenue growth over the last five years was tepid. This fell short of our benchmark for the industrials sector and is a tough starting point for our analysis.
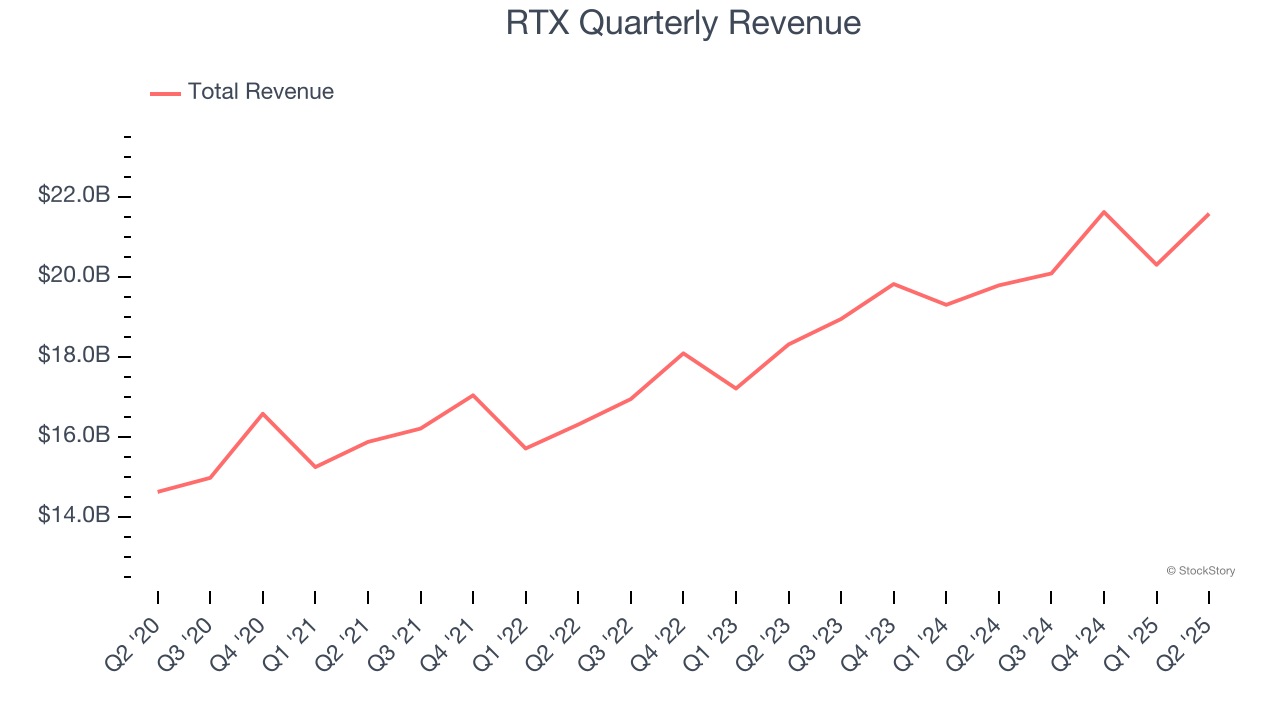
We at StockStory place the most emphasis on long-term growth, but within industrials, a half-decade historical view may miss cycles, industry trends, or a company capitalizing on catalysts such as a new contract win or a successful product line. RTX’s annualized revenue growth of 8.8% over the last two years is above its five-year trend, suggesting some bright spots. 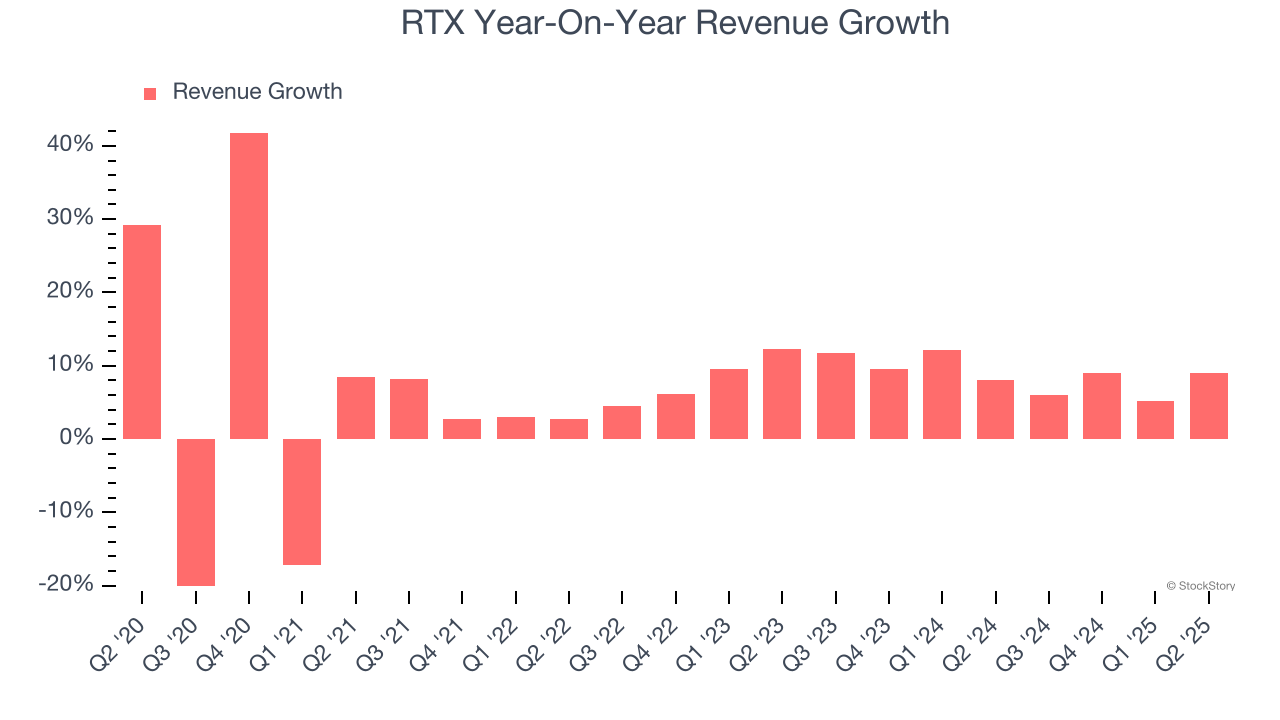
We can dig further into the company’s sales dynamics by analyzing its organic revenue, which strips out one-time events like acquisitions and currency fluctuations that don’t accurately reflect its fundamentals. Over the last two years, RTX’s organic revenue averaged 10.6% year-on-year growth. Because this number is better than its normal revenue growth, we can see that some mixture of divestitures and foreign exchange rates dampened its headline results. 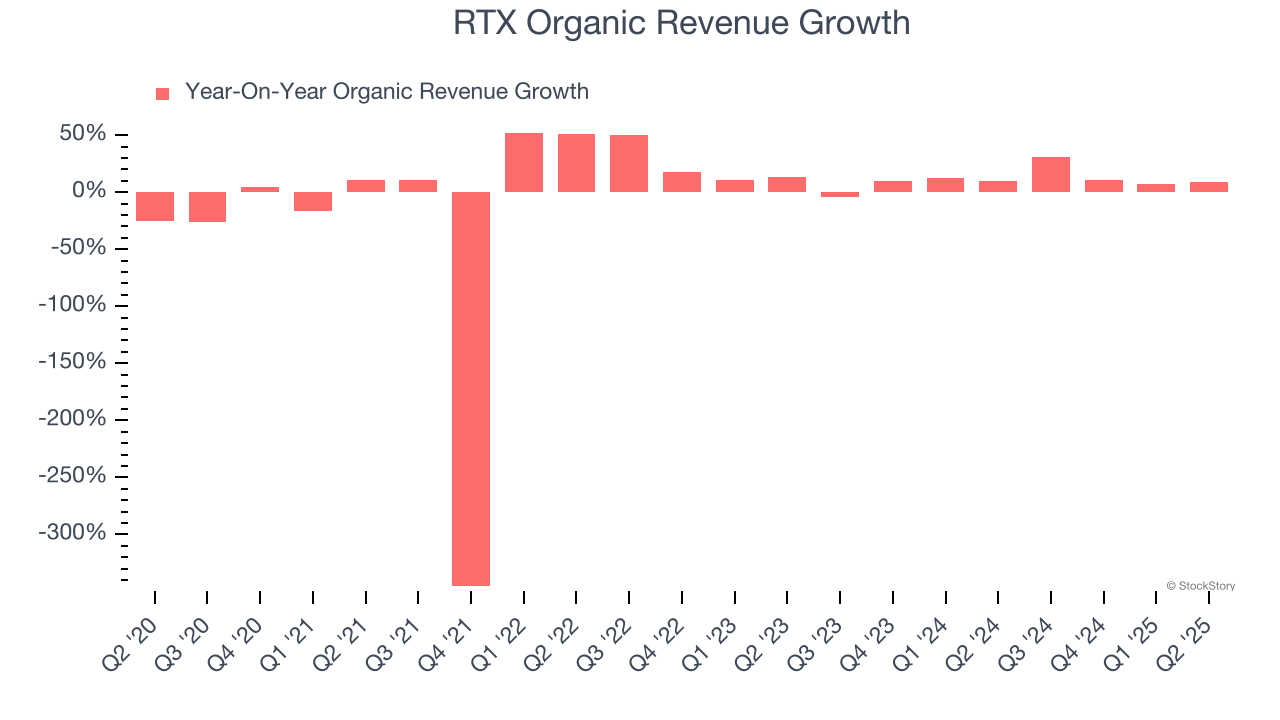
This quarter, RTX reported year-on-year revenue growth of 9%, and its $21.58 billion of revenue exceeded Wall Street’s estimates by 4.4%.
Looking ahead, sell-side analysts expect revenue to grow 3.4% over the next 12 months, a deceleration versus the last two years. This projection doesn't excite us and indicates its products and services will face some demand challenges.
Unless you’ve been living under a rock, it should be obvious by now that generative AI is going to have a huge impact on how large corporations do business. While Nvidia and AMD are trading close to all-time highs, we prefer a lesser-known (but still profitable) stock benefiting from the rise of AI. Click here to access our free report one of our favorites growth stories.
Operating Margin
RTX was profitable over the last five years but held back by its large cost base. Its average operating margin of 7% was weak for an industrials business.
On the plus side, RTX’s operating margin rose by 5.4 percentage points over the last five years, as its sales growth gave it operating leverage.
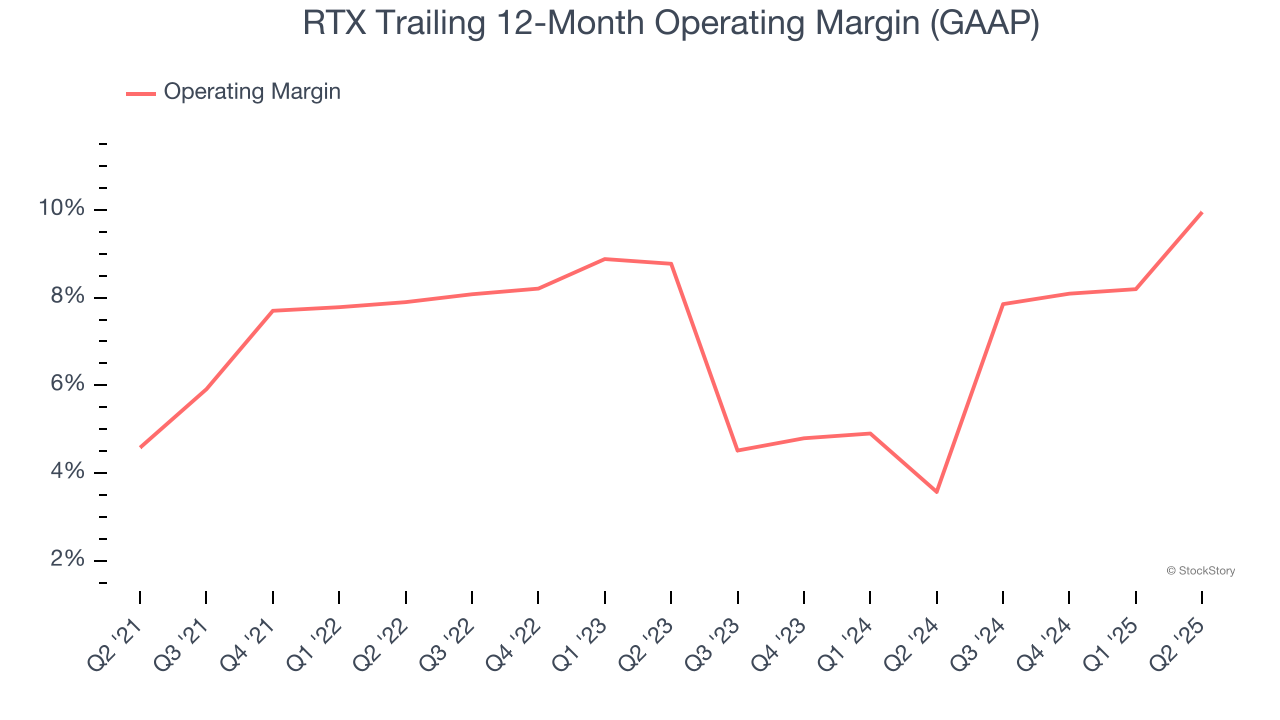
In Q2, RTX generated an operating margin profit margin of 9.9%, up 7.3 percentage points year on year. This increase was a welcome development and shows it was more efficient.
Earnings Per Share
We track the long-term change in earnings per share (EPS) for the same reason as long-term revenue growth. Compared to revenue, however, EPS highlights whether a company’s growth is profitable.
RTX’s unimpressive 4.8% annual EPS growth over the last five years aligns with its revenue performance. On the bright side, this tells us its incremental sales were profitable.
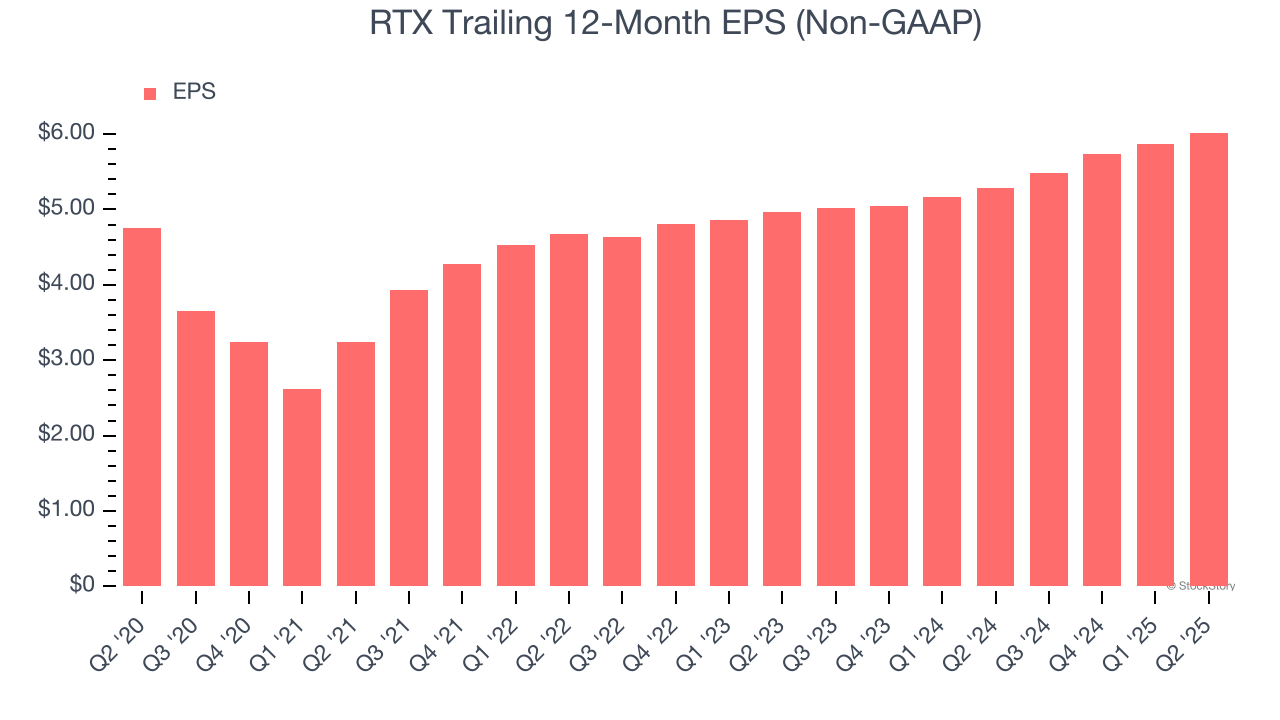
Like with revenue, we analyze EPS over a shorter period to see if we are missing a change in the business.
For RTX, its two-year annual EPS growth of 10% was higher than its five-year trend. This acceleration made it one of the faster-growing industrials companies in recent history.
In Q2, RTX reported EPS at $1.56, up from $1.41 in the same quarter last year. This print beat analysts’ estimates by 9.1%. Over the next 12 months, Wall Street expects RTX’s full-year EPS of $6.02 to grow 2.6%.
Key Takeaways from RTX’s Q2 Results
We liked how RTX beat analysts’ organic revenue expectations this quarter. On the other hand, its full-year EPS guidance was lowered and missed expectations due to the company's "current assessment of the impact of tariffs". This weighed on shares, and the stock traded down 2.1% to $148.50 immediately following the results.
Is RTX an attractive investment opportunity right now? When making that decision, it’s important to consider its valuation, business qualities, as well as what has happened in the latest quarter. We cover that in our actionable full research report which you can read here, it’s free.