

Infrastructure and agriculture equipment manufacturer Valmont Industries (NYSE:VMI) announced better-than-expected revenue in Q2 CY2025, with sales up 1% year on year to $1.05 billion. The company expects the full year’s revenue to be around $4.1 billion, close to analysts’ estimates. Its non-GAAP profit of $4.88 per share was 2.1% above analysts’ consensus estimates.
Is now the time to buy Valmont? Find out by accessing our full research report, it’s free.
Valmont (VMI) Q2 CY2025 Highlights:
- Revenue: $1.05 billion vs analyst estimates of $1.03 billion (1% year-on-year growth, 1.7% beat)
- Adjusted EPS: $4.88 vs analyst estimates of $4.78 (2.1% beat)
- The company reconfirmed its revenue guidance for the full year of $4.1 billion at the midpoint
- Adjusted EPS guidance for the full year is $18 at the midpoint, missing analyst estimates by 0.9%
- Operating Margin: 2.8%, down from 14.2% in the same quarter last year
- Free Cash Flow Margin: 9.1%, down from 10.8% in the same quarter last year
- Backlog: $1.58 billion at quarter end
- Market Capitalization: $6.66 billion
President and Chief Executive Officer Avner M. Applbaum commented, “We delivered a solid quarter operationally, with continued strength in Utility, Telecommunications, and International Agriculture. Our teams executed well, driving volume growth in key markets while advancing our long-term strategy. We remain focused on our key value drivers: capturing infrastructure demand by expanding Utility capacity and throughput, positioning our Agriculture segment for long-term growth through international expansion and technology solutions, and maintaining disciplined capital and resource allocation."
Company Overview
Credited with an invention in the 1950s that improved crop yields, Valmont (NYSE:VMI) provides engineered products and infrastructure services for the agricultural industry.
Revenue Growth
Reviewing a company’s long-term sales performance reveals insights into its quality. Any business can put up a good quarter or two, but many enduring ones grow for years. Thankfully, Valmont’s 8.3% annualized revenue growth over the last five years was decent. Its growth was slightly above the average industrials company and shows its offerings resonate with customers.
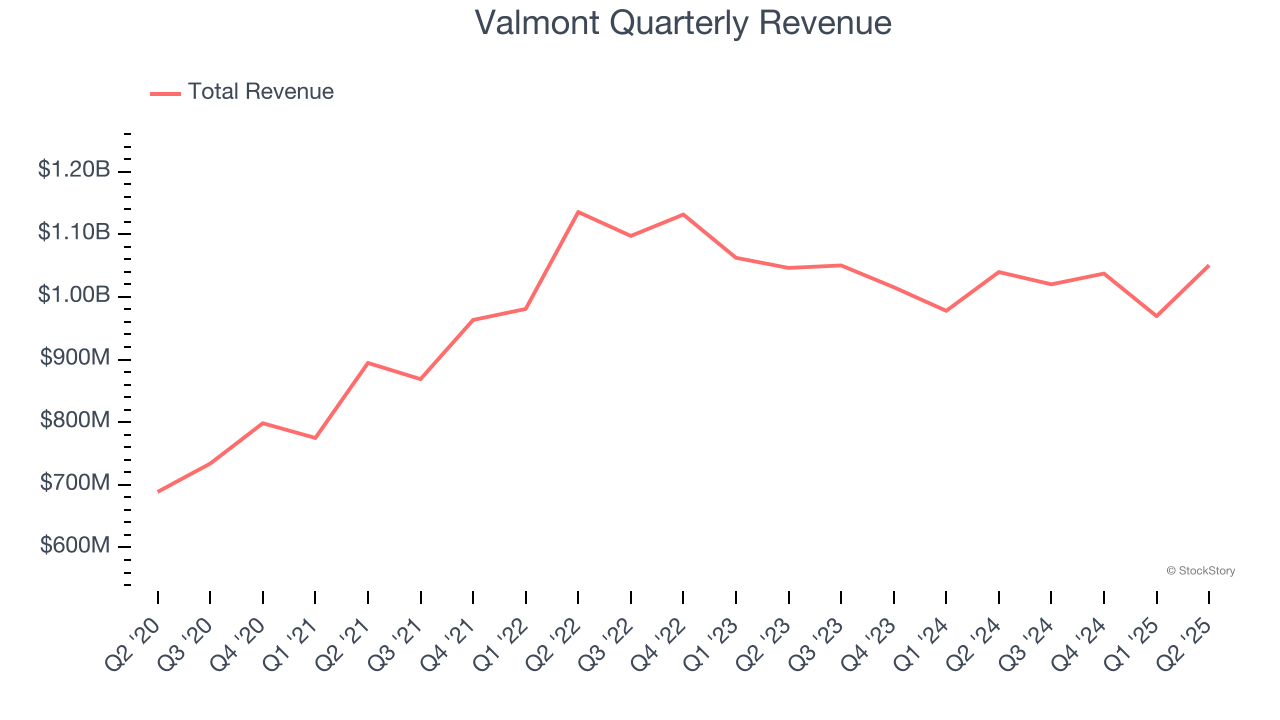
We at StockStory place the most emphasis on long-term growth, but within industrials, a half-decade historical view may miss cycles, industry trends, or a company capitalizing on catalysts such as a new contract win or a successful product line. Valmont’s recent performance marks a sharp pivot from its five-year trend as its revenue has shown annualized declines of 3% over the last two years. 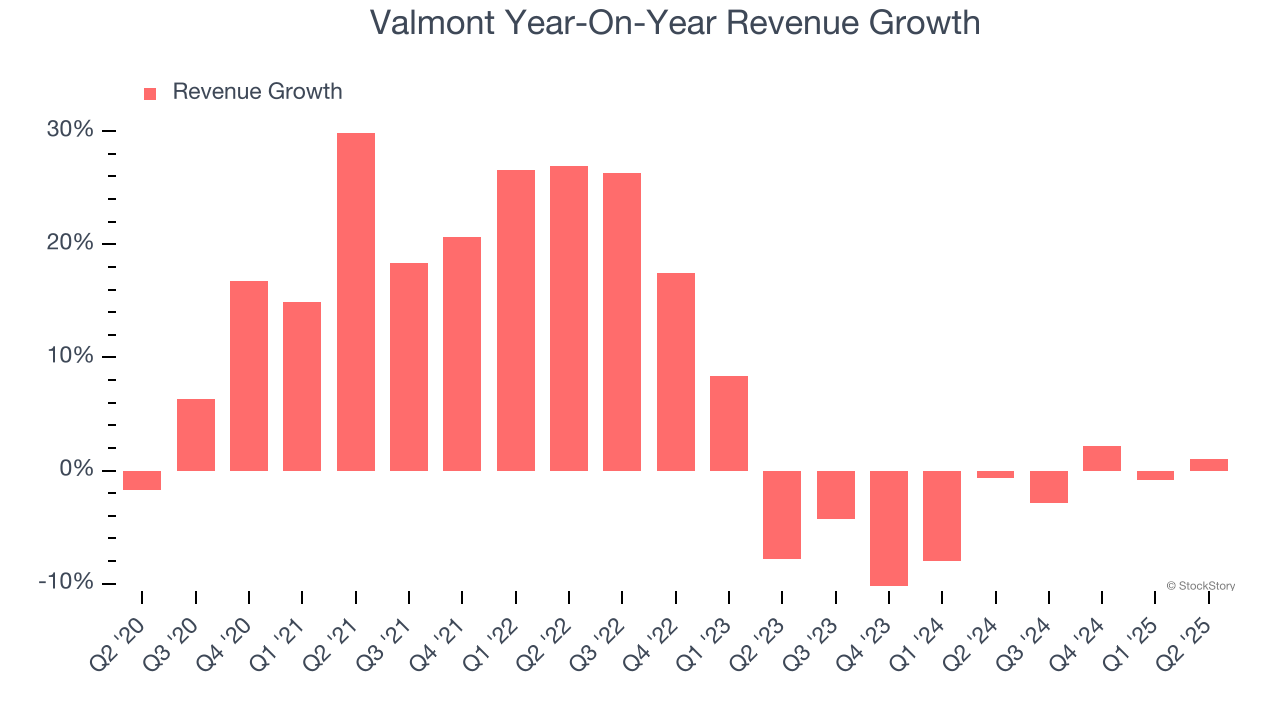
This quarter, Valmont reported modest year-on-year revenue growth of 1% but beat Wall Street’s estimates by 1.7%.
Looking ahead, sell-side analysts expect revenue to grow 1.8% over the next 12 months. Although this projection indicates its newer products and services will catalyze better top-line performance, it is still below average for the sector. At least the company is tracking well in other measures of financial health.
Here at StockStory, we certainly understand the potential of thematic investing. Diverse winners from Microsoft (MSFT) to Alphabet (GOOG), Coca-Cola (KO) to Monster Beverage (MNST) could all have been identified as promising growth stories with a megatrend driving the growth. So, in that spirit, we’ve identified a relatively under-the-radar profitable growth stock benefiting from the rise of AI, available to you FREE via this link.
Operating Margin
Operating margin is a key measure of profitability. Think of it as net income - the bottom line - excluding the impact of taxes and interest on debt, which are less connected to business fundamentals.
Valmont has done a decent job managing its cost base over the last five years. The company has produced an average operating margin of 9.2%, higher than the broader industrials sector.
Looking at the trend in its profitability, Valmont’s operating margin rose by 1.3 percentage points over the last five years, as its sales growth gave it operating leverage.
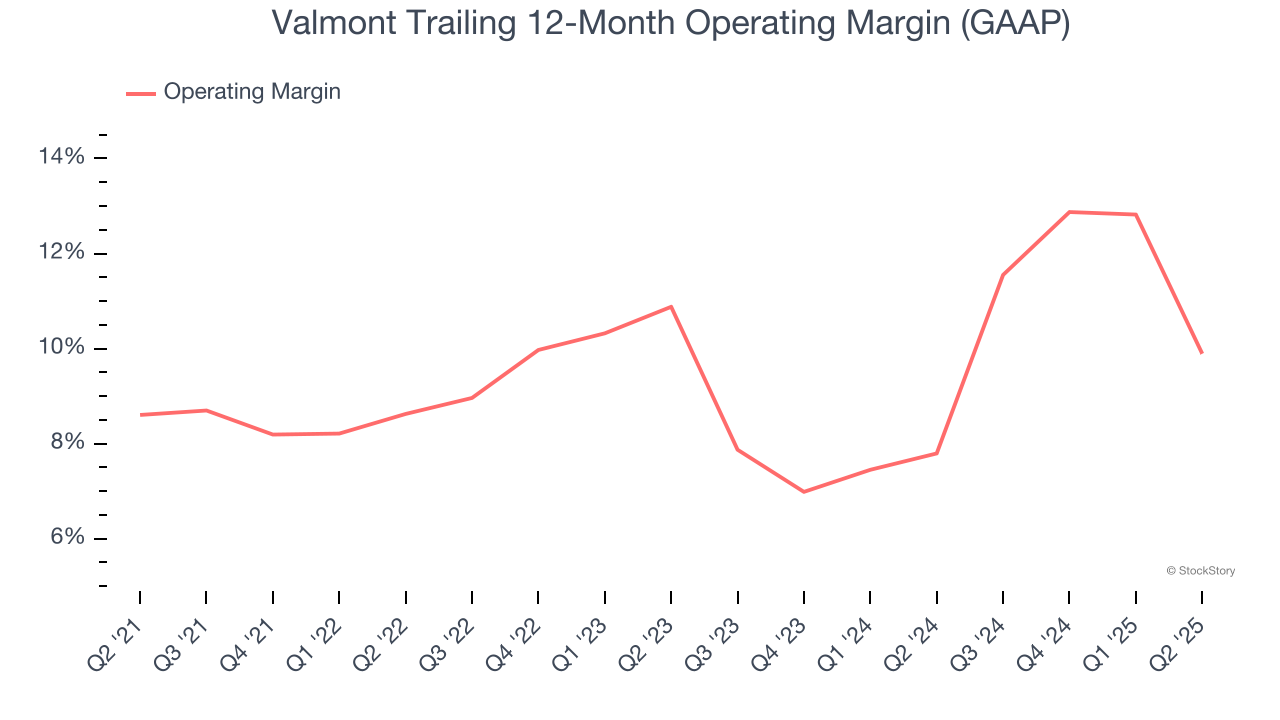
This quarter, Valmont generated an operating margin profit margin of 2.8%, down 11.4 percentage points year on year. Since Valmont’s operating margin decreased more than its gross margin, we can assume it was less efficient because expenses such as marketing, R&D, and administrative overhead increased.
Earnings Per Share
Revenue trends explain a company’s historical growth, but the long-term change in earnings per share (EPS) points to the profitability of that growth – for example, a company could inflate its sales through excessive spending on advertising and promotions.
Valmont’s EPS grew at an astounding 18% compounded annual growth rate over the last five years, higher than its 8.3% annualized revenue growth. This tells us the company became more profitable on a per-share basis as it expanded.
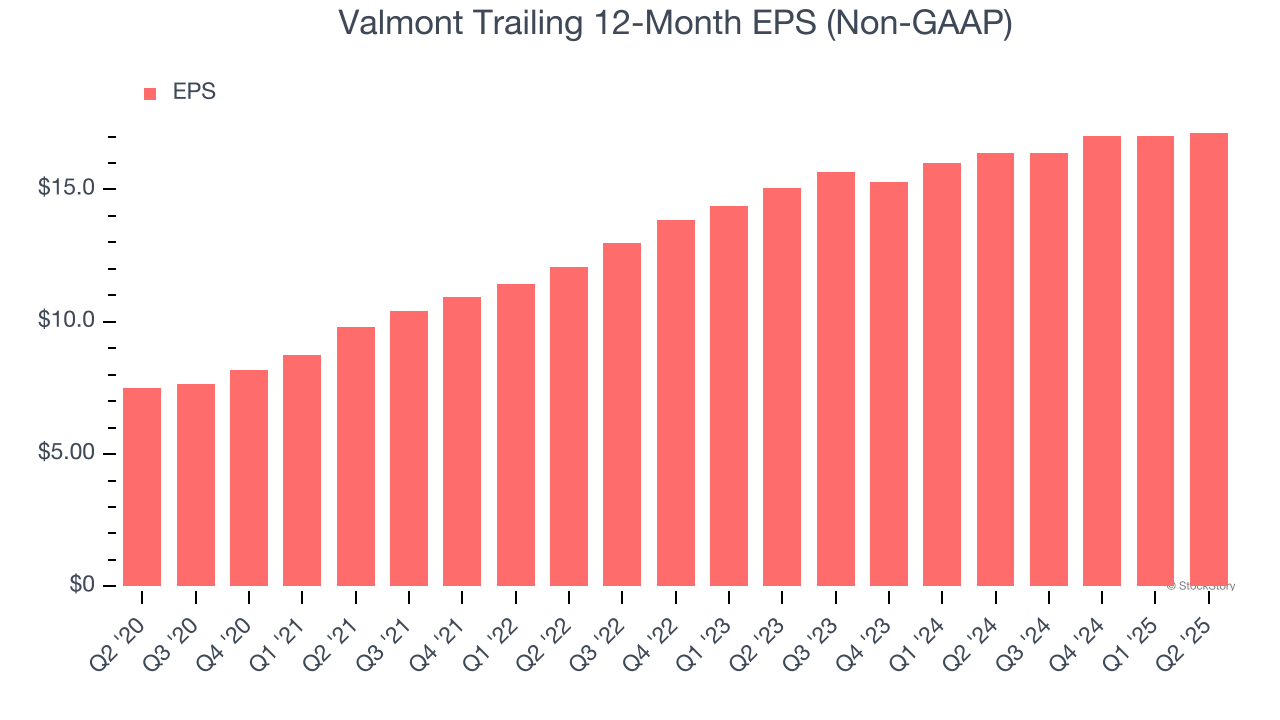
We can take a deeper look into Valmont’s earnings to better understand the drivers of its performance. As we mentioned earlier, Valmont’s operating margin declined this quarter but expanded by 1.3 percentage points over the last five years. Its share count also shrank by 7.4%, and these factors together are positive signs for shareholders because improving profitability and share buybacks turbocharge EPS growth relative to revenue growth. 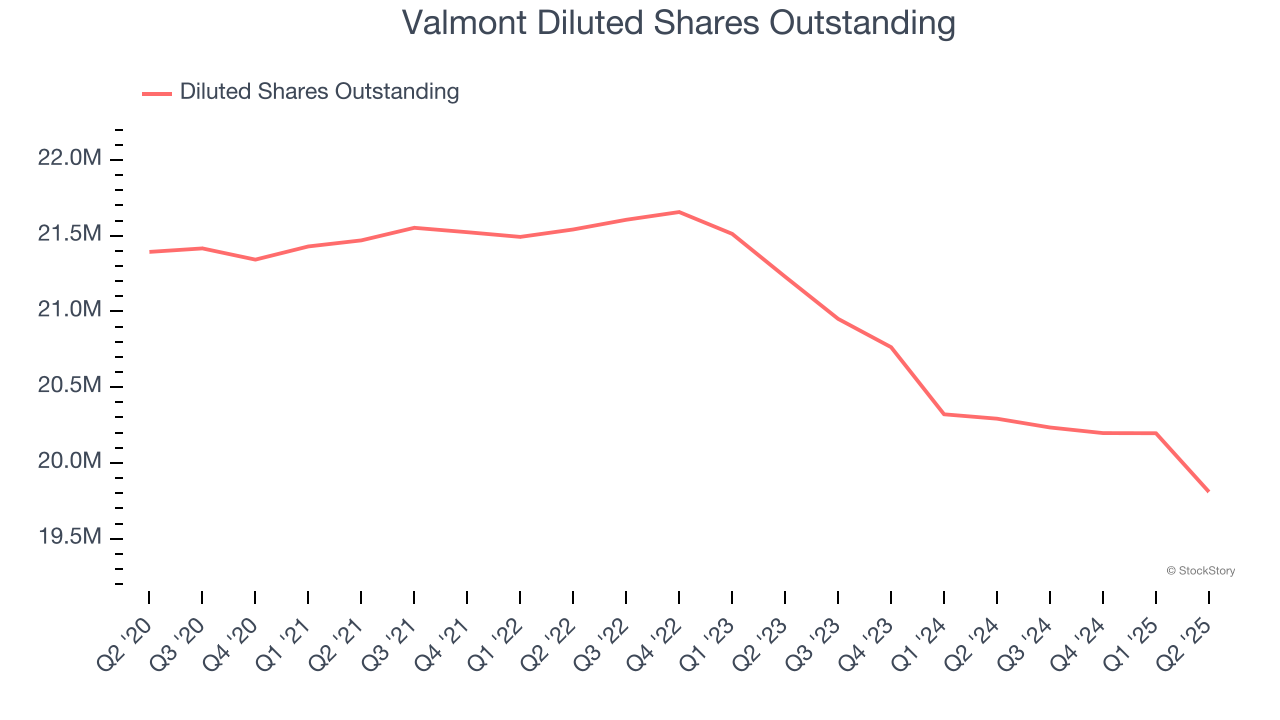
Like with revenue, we analyze EPS over a shorter period to see if we are missing a change in the business.
For Valmont, its two-year annual EPS growth of 6.8% was lower than its five-year trend. This wasn’t great, but at least the company was successful in other measures of financial health.
In Q2, Valmont reported EPS at $4.88, up from $4.76 in the same quarter last year. This print beat analysts’ estimates by 2.1%. We also like to analyze expected EPS growth based on Wall Street analysts’ consensus projections, but there is insufficient data.
Key Takeaways from Valmont’s Q2 Results
It was encouraging to see Valmont beat analysts’ revenue and EPS expectations this quarter. On the other hand, its full-year EPS guidance fell slightly short of Wall Street’s estimates. Overall, this quarter was mixed. The stock traded up 1.7% to $337.90 immediately following the results.
Big picture, is Valmont a buy here and now? If you’re making that decision, you should consider the bigger picture of valuation, business qualities, as well as the latest earnings. We cover that in our actionable full research report which you can read here, it’s free.